- What we offer?
- Why embedded?
- > Services
- > Product Portfolio
- > References
- > Live DEMO
- About us
- Contact
- e-shop

 Deutsch
Live Demo / JavaScript and XML
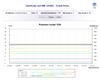
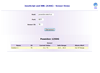
JavaScript + XML DEMO - Graph and Sensor
- These two examples gathers data from sensors attached to the Poseidon unit and displays them to graph or table with values.
- Both examples require connection to an online Poseidon unit:
poseidon.etech.cz (86.63.210.169) Turnov, Czech republic
poseidon.hwg.cz (80.250.21.84) Prague, Czech republic
- Works only in Mozilla Firefox browser. You need to do a bit of configuration:
1) Open a new tab in the browser
2) Type into the addressbar about:config
3) Confirm security question, the configuration window will appear
4) Search for parameter signed.applets.codebase_principal_support
5) Change its value by doubleclicking to true.
6) Run the demo.
News
3.8.2009
MetrologySolar Monitor - brand new monitoring unit for photovoltaic plants. Combines simplicity and innovative features for maximum user satisfaction.
7.4.2009
MetrologyRunning Web Portal for analysis of measured values. Multi-purpose use. This demo displays data from our office.
13.1.2009
NetworkingUnique web-update in LAN Analyser: you can easily update the device with one file containing the Bootloader, Linux kernel and the filesystem via web browser.